How We Measured Whether Our Docs Actually Worked
Page views told us people were reading. They didn't tell us whether anyone succeeded. Here's how I ran A/B tests on API documentation using task completion, time to first successful request, and support ticket volume.
At a large developer platform, I documented a catalog of AI models that developers called through an API. We were shipping pages quickly, and our dashboards looked healthy: traffic was up, bounce rates were fine, and the feedback widget leaned positive.
But none of that answered the question that actually mattered: when a developer landed on a page, did they get the model working? This article walks through how I turned that question into a set of measurable outcomes and ran controlled experiments on the docs themselves.
Why the usual docs metrics mislead
Most documentation teams measure attention, not outcomes. The common signals each have a blind spot:
- Page views rise when docs are confusing, because people come back to re-read.
- Time on page is ambiguous. Five minutes could mean deep engagement or a developer stuck on step three.
- Thumbs up/down widgets capture a tiny, self-selected slice of readers, usually the very happy or the very frustrated.
- Search volume tells you what people look for, not whether they found it. Documentation exists to help someone complete a task. So the metric should be whether they completed it, how quickly, and whether they needed a human to help.
Three metrics that measure outcomes
I settled on one primary metric and two supporting ones. Each maps to a different failure mode.
| Metric | Question it answers | How it's defined | Direction we want |
|---|---|---|---|
| Task completion rate | Did the developer finish what they came to do? | Share of sessions that reach a defined success event (for example, a 200 response from the model endpoint) after viewing the page | Up |
| Time to first successful request (TTFSR) | How much friction stood between reading and working? | Time from first page view to first successful API call by that developer | Down |
| Support ticket volume | Did the docs leave people needing a human? | Tickets tagged to the documented product, normalised per 1,000 active developers | Down |
Task completion was the primary metric because it most directly reflects the purpose of the page. TTFSR caught a subtler problem: docs where people eventually succeeded, but only after trial and error. Ticket volume was a lagging guardrail, useful for confirming that a win in the experiment held up in the real world.
Define success narrowly. "Made an API call" is too loose, because a failed call with a 401 error is still a call. Success should be the specific outcome the page promises.
Designing the experiment
An A/B test on docs follows the same logic as one on a product feature, with a few twists.
- Pick one change per test. We compared a control page against a variant with a single structural change: a copy-paste quickstart block above the fold, versus the original reference-first layout.
- Randomise at the developer level, not the page view. If the same person sees version A on Monday and version B on Tuesday, you can't attribute their success to either. Assign by a stable identifier and keep them in their bucket.
- Estimate sample size before you start. Docs traffic is lumpier than product traffic. Use your baseline completion rate and the smallest lift worth acting on to work out how many developers each arm needs, then commit to that number.
- Fix the duration. Run for full weeks so weekday and weekend developers are both represented, and don't stop early because the dashboard looks good.
- Set guardrails. We watched ticket volume and page error reports so that a "win" on completion didn't hide a new problem elsewhere. The hardest part was resisting the urge to change several things at once. A variant that rewrites the intro, adds code samples, and restructures the headings might win, but you won't know why.
Instrumenting the docs
The metrics only work if you can join a docs session to what the developer did next in the product. That means two event streams sharing a key: docs events (page view, variant assigned) and API events (request made, response status).
Once both land in the same warehouse, the core calculation is a join and a window. Here's a simplified version of the query I used for task completion and TTFSR:
WITH exposures AS (
  SELECT developer_id,
         variant,
         MIN(viewed_at) AS first_view
  FROM docs_page_views
  WHERE page_slug = 'model-quickstart'
    AND viewed_at >= '2025-01-06' AND viewed_at < '2025-02-03'  -- four full weeks, Monday to Sunday
  GROUP BY developer_id, variant
),
first_success AS (
  SELECT r.developer_id,
         MIN(r.requested_at) AS first_ok
  FROM api_requests r
  JOIN exposures e USING (developer_id)
  WHERE r.status_code = 200
    AND r.requested_at >= e.first_view
    AND r.requested_at < e.first_view + INTERVAL '24 hours'
  GROUP BY r.developer_id
)
SELECT e.variant,
       COUNT(*) AS developers,
       AVG(CASE WHEN f.first_ok IS NOT NULL THEN 1.0 ELSE 0 END) AS completion_rate,
       PERCENTILE_CONT(0.5) WITHIN GROUP (
         ORDER BY EXTRACT(EPOCH FROM f.first_ok - e.first_view)
       ) / 60 AS median_ttfsr_minutes
FROM exposures e
LEFT JOIN first_success f USING (developer_id)
GROUP BY e.variant;
A few choices worth calling out:
- The 24-hour window defines what "after reading the docs" means. Too short and you miss developers who read at night and build in the morning; too long and you credit the docs for success that came from elsewhere.
- Median, not mean, for TTFSR. A handful of developers who wander off for three days will wreck an average.
- Ticket volume came from the support system, tagged by product area and joined by week, since tickets rarely carry a docs session ID. If your events live in a product analytics tool such as Amplitude rather than a warehouse, the same logic maps to a two-step funnel (docs page viewed, then successful API request) with a 24-hour conversion window, grouped by the variant property.
What we found
A note on the data: the figures in this section come from a simulated dataset I built to demonstrate the method. They are illustrative, not results from any real company. The dataset and code are linked at the end so you can reproduce every number.
In the simulation, the variant page raised task completion from 41.1% to 47.2% and cut median time to first successful request from 27 to 18 minutes.
| Metric | Control | Variant | Change |
|---|---|---|---|
| Developers in test | 4,000 | 4,000 | |
| Task completion rate (95% CI) | 41.1% (39.5 to 42.6) | 47.2% (45.7 to 48.7) | +6.1 pts |
| Median TTFSR (minutes) | 27.4 | 17.8 | -35% |
| Support tickets per 1,000 active developers (4-week average) | 14.6 before rollout | 11.2 after rollout | -23% |
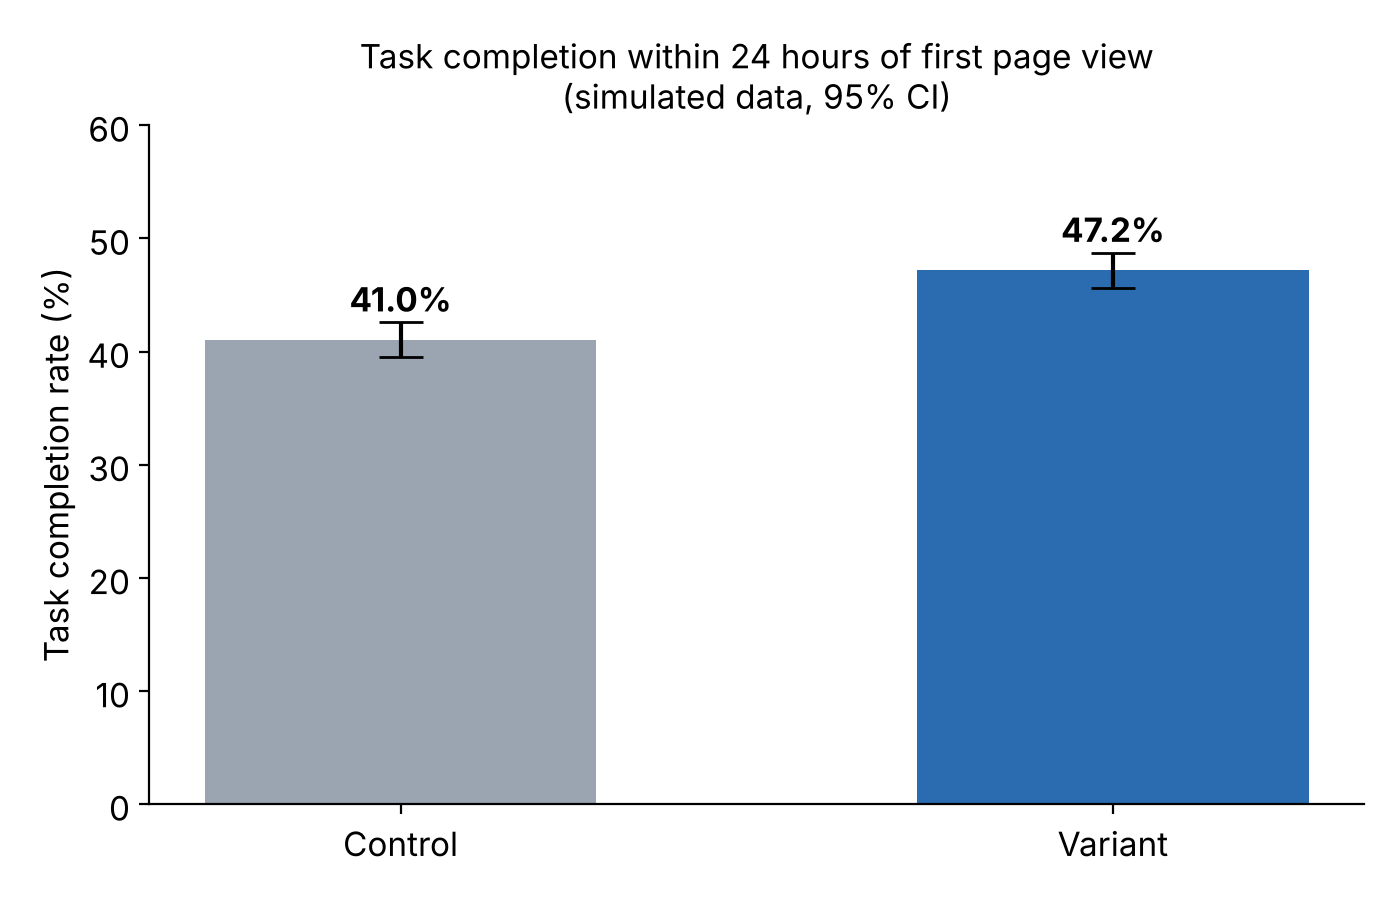
Figure 1: Task completion within 24 hours of first page view, by variant (simulated data, 95% CI).
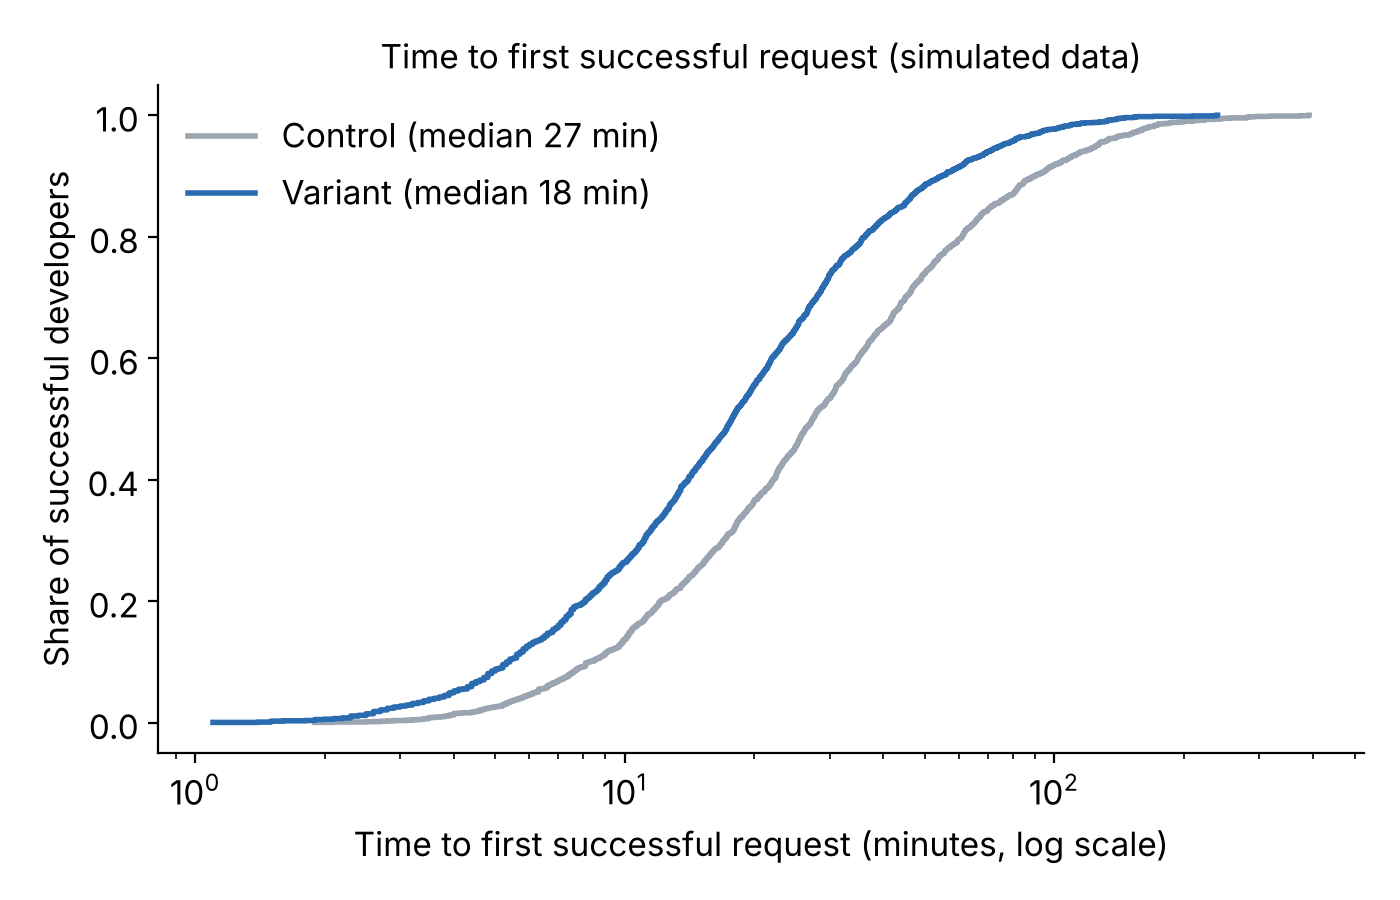
Figure 2: Cumulative distribution of time to first successful request (simulated data, log scale).
Both differences are well beyond chance at this sample size: a chi-square test on completion and a Mann-Whitney U test on TTFSR each give p < 0.001. The cumulative distribution in Figure 2 is more useful than the medians alone. The variant curve sits to the left across almost the whole range, so the improvement isn't driven by a few fast developers; most people got there sooner.
Ticket volume can't be split by variant, because tickets rarely carry a docs session ID. So it's shown as a before-and-after comparison once the variant rolled out to everyone (Figure 3). Treat it as supporting evidence, not proof.
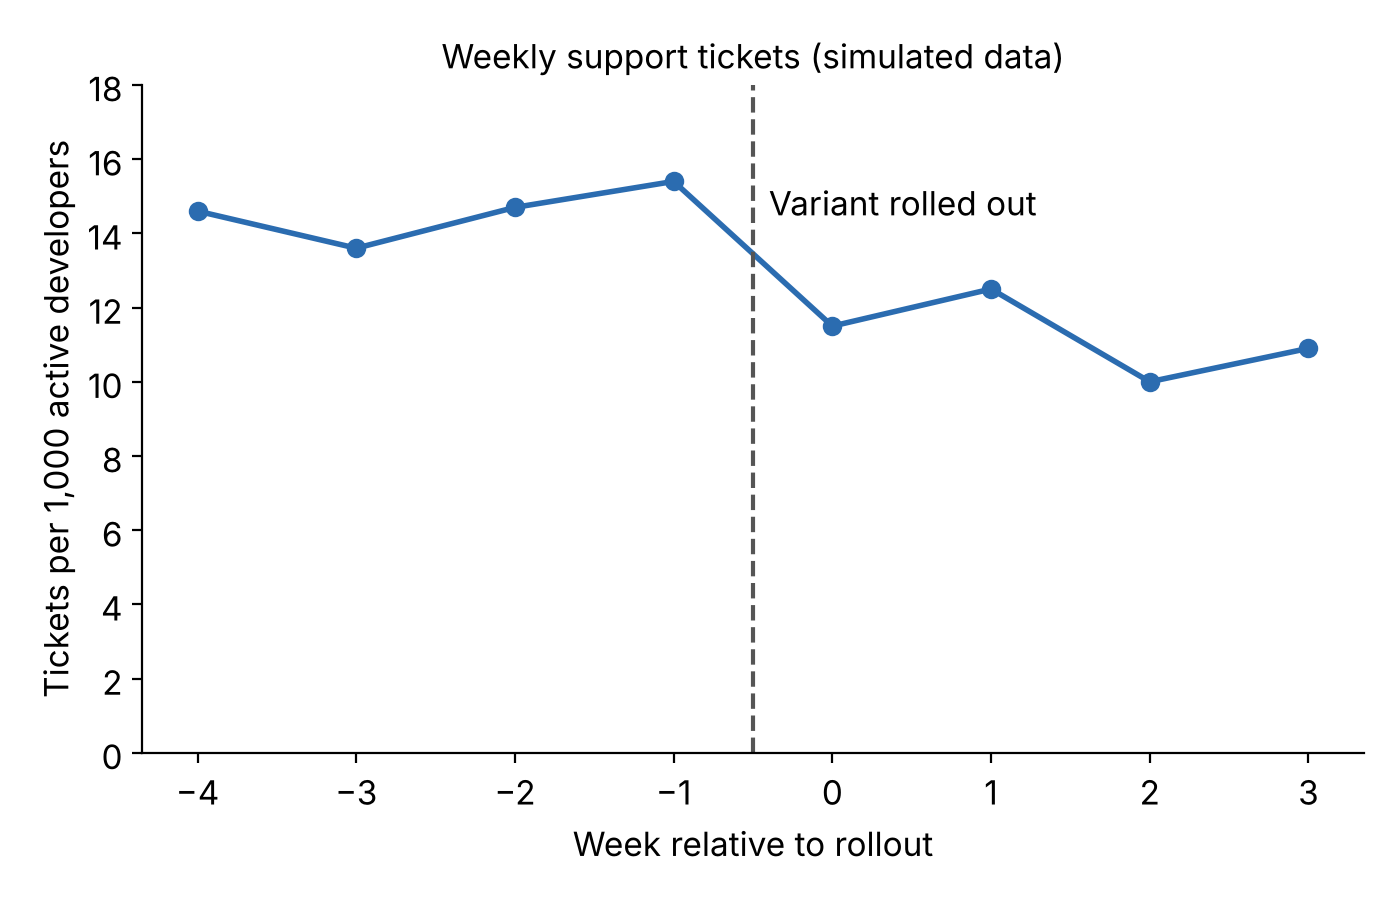
Figure 3: Weekly support tickets per 1,000 active developers, four weeks either side of rollout (simulated data).
In real projects, effects are often smaller and noisier than this. A lift of a few points on completion can still be worth shipping if the page sits at the top of a high-traffic onboarding path.
Lessons and pitfalls
- Search engines don't respect your buckets. A developer who arrives from search may land on a cached or indexed version. Serve variants server-side and keep URLs identical so search traffic is assigned like everyone else.
- Novelty effects are real. Returning developers sometimes engage more with a page simply because it changed. Look at new and returning developers separately.
- Not every page can be tested. Low-traffic reference pages won't reach a meaningful sample in a reasonable time. Save experiments for high-traffic entry points like quickstarts, and use qualitative methods (user interviews, session reviews) elsewhere.
- Product changes contaminate results. If the API itself changes mid-test, pause or restart. We coordinated test windows with the engineering release calendar.
- Tickets lag. Support volume responds over weeks, not days. Treat it as confirmation after the test, not a decision metric during it.
- Expect most variants to lose. The simulated variant here wins cleanly, but real experiments rarely do. Ron Kohavi, who led experimentation at Microsoft, reported that across their controlled experiments only about a third of ideas improved the metric they targeted; a third made no significant difference, and a third made it worse (Kohavi, 2012). There's no reason to think documentation ideas are luckier. A flat or negative result still pays for itself: it stops you rolling out a "best practice" across hundreds of pages that wouldn't have helped anyone.
Treat docs like a product
Documentation is often the first product a developer touches, yet it's rarely held to the same evidence standard as the product itself. Measuring outcomes changed how our team prioritised work: we stopped debating opinions about layout and started asking which version helped more people ship.
If you want to try this on your own docs, start here:
- Pick one high-traffic entry page.
- Define a narrow, observable success event.
- Make sure docs sessions and API events share a developer ID.
- Calculate your baseline completion rate and TTFSR before changing anything.
- Test one change, at the developer level, for a fixed number of full weeks.
- Confirm the result against support tickets afterwards. You don't need a large team to do this. You need a clear definition of success and the discipline to measure it.
The simulated dataset, analysis code and figures for this article are on GitHub: docs-ab-testing-simulation.
Comments
Join the discussionNo comments yet. Be the first to comment.

